Main purpose of this tab is to find hot code spots, dead code and analyse code & test coverage as well as analyse timing for the running computer and CPU.
the 'Tools' tab and then the 'Profiler' tab. Note that the profiler only runs and shows active data when an emulator is running.
Before starting an emulator the profiler can be switched off with the 'Counters On/Off' selector. During run time the 'Counters Clear' button will reset all counters to 0.
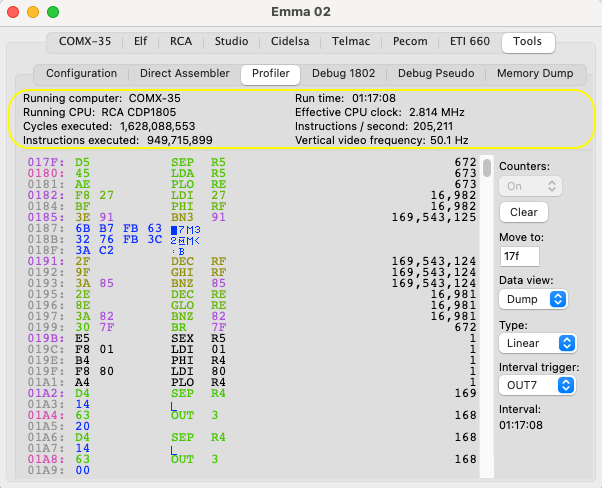
The top part (highlighted in yellow) shows the following timing details:
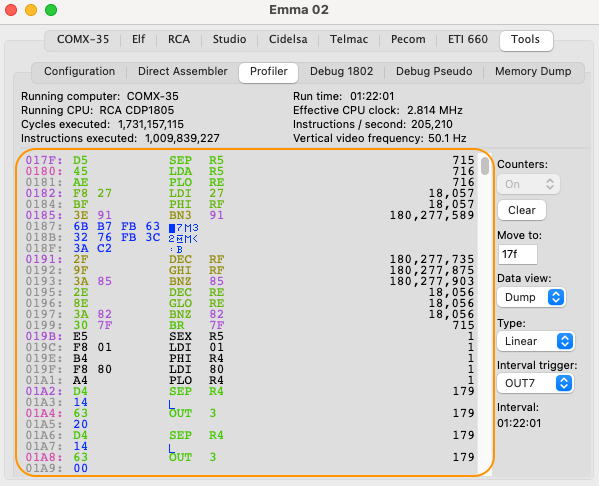
The bottom left part (highlighted in orange) shows the profiler which can be used for the following:
On the profiler tab only a small number of locations are shown at anyone time, to be able to scan through memory quicker the profiler on the Memory Dump tab can be used:
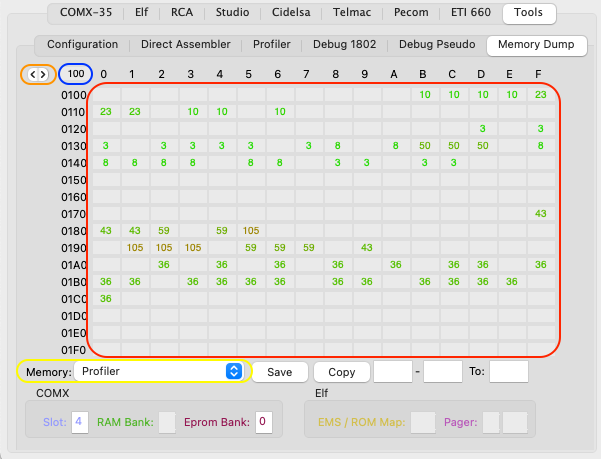
To select the memory dump profiler, first select the Memory Dump tab and then as 'Memory' select 'Profiler' (highlighted in yellow). Then 256 addresses will be shown (highlighted in red) each containing one counter value between 1 and 255 in the same colour as used on the profiler tab with 'redder' colour instructions being executed more frequently. The shown counter uses the same logarithmic scale as the colour definition. Formula used is 5*ln(number of executions).
To change to the previous or next page use the buttons highlighted in the orange, alternatively specify a specific address in the field highlighted in blue.
For additional details about the Memory Dump tab see also the Memory Dump section.
Additional Information can be found in the following sub-sections:
Navigation
Data View
Linear & Logarithmic Counters
Hot Code Spots
Dead Code Spots
Code Coverage
Interval Timer