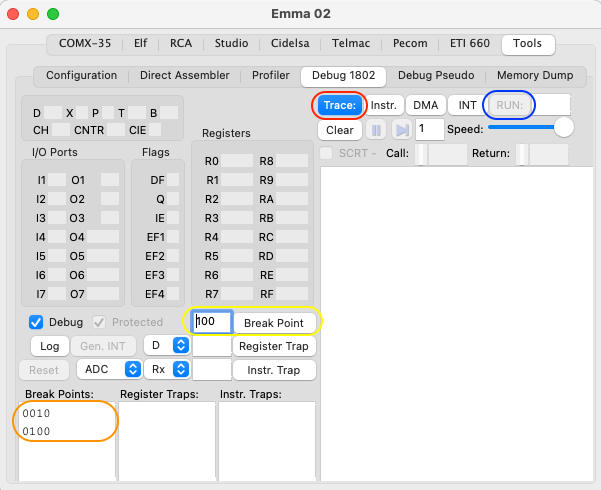
Set a break point (field and button highlighted in yellow) at the start and end of your section. Emulation will stop when the break point is hit, delete the break point in the break point area (highlighted in orange) and turn on the trace ('Trace:' button highlighted in red). To start the actual trace press RUN (highlighted in blue) and when it stops again turn off the trace (highlighted in red).
Edit the break points in the orange break points area by pressing the 'delete' key to remove a break point or double click a break point to change the address value. On Windows you can also deactivate a break point by unselecting the checkboxes before the address values.
Above example would stop at address 0x10 and 0x100 whichever is detected first.
Other trace options that can be used are the 'Register Trap' for a register reaching a specific value or the 'Instr. Trap' for a specific instruction being executed.
For more details see also section Debug 1802